Media

Ethnographic Edge’s Crystal Ball
We are entering the era of data, an era which provides us with infinite possibilities. There is no doubt that the impact of big data on future generations will be unprecedented. From formulating economic forecasts on Wall Street to predicting epidemic outbreaks in Africa, researchers and academics have been trying to make sense of this ocean of information in many different ways. Focusing on how to use this crystal ball to make sense of recurring international and humanitarian crises, a London-based research center, Ethnographic Edge, has been using Data Analytics technologies in combination with ethnographic methods of analysis. In the past two years of tests, Ethnographic Edge has had 80% of accuracy in its predictions.
The method is rather simple: they look at mainstream media publications and quantify the ‘sentiment’ in the media using Data Analytics technology provided by Recorded Future. Values are then synthesized and organized over time as a moving average. This data is mixed with other indicators, such as search trends and blog activity, to create signals that forecast whether media coverage is likely to increase or decrease over time.
Through the application of predictive algorithms that scan historical data in search of recurring patterns it is possible to then look for similar patterns in real time data. When similar patterns are found, a positive or negative signal is created. Once a signal is created, an analysis of the events unfolding at the time is completed using ethnographic methods to confirm the forecast.
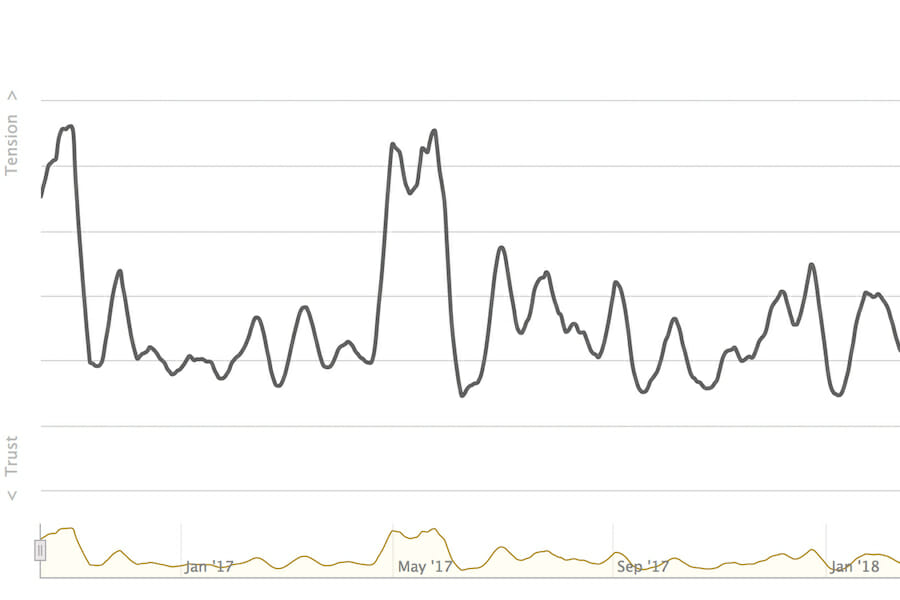
On June 3rd 2013, Ethnographic Edge registered a signal for a 13 days trending negative cycle on Turkey. Several days prior to the signal, tensions had started in Istanbul following protests against the construction of a shopping mall on Taksim Square. Following an analysis of the strategic and social factors influencing the events, researchers at Ethnographic Edge concluded that the protests were indeed likely to continue, and foresaw, among other things, that the upheavals were going to have a negative effect on the Turkish stock market and the relative value of the Turkish Lira. The red dot on the graph above represents the day the negative trend signal was registered (June 3rd). The days following the signal the media’s attention towards Turkey rapidly increased. The following green dot, registered on June 18, represents a positive forecast signaling that media coverage of Turkey would soon decrease. As the graph shows, both forecasts were correct. For convenience, the graph also relates the attention of the media to the Turkish stock market (represented by the yellow line below). The graph shows how the value of Turkish stocks fell rapidly when the first signal was formulated, and then stabilized after the second signal was generated.
For more reporting on global crises visit Ethnographic Edge.